Rules for Sorting
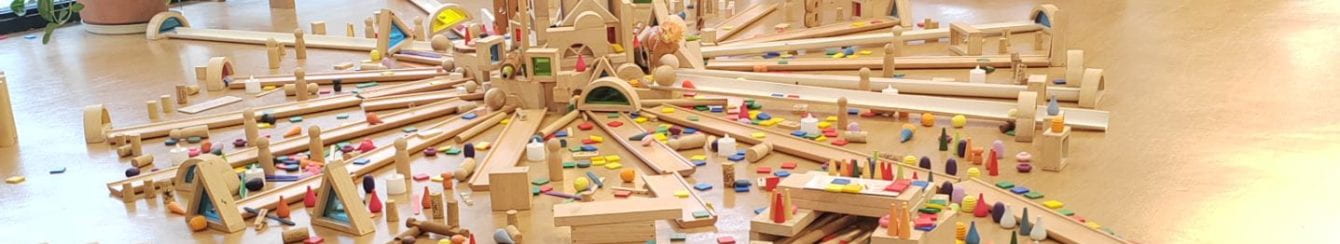
We have noticed the children categorising everyday objects around the campfire as they play and construct with different objects and materials. We decided to present the Mathematicians with an opportunity to sort, categorise and organise a collection of objects to help them explore how objects can be organised in different ways.

To help them think about this further, we referred to prior documentation from the ‘waste’ project, when the children sorted the different foods into groups and discussed their rules for the sort.

The children noticed that:
- Isabella “Pictures tell what it is.”
- Adalyn “Words at the bottom tell everybody what is that picture.”
- Riccardo “There are numbers because you can tell how high the people like more food.”
- Evan “How many food there are.”
The children worked in teams to sort out the different collections. We discussed the skills they would need to use to complete the team challenge.

 One team was given a collection of loose parts. As they observed the contents of the basket, they decided to sort it by shape. The team were invited to think about other ways to sort the objects.
 Next, they decided to sort the objects by colour. They noticed that the coloured objects also had different shapes and put them into new categories sorted by shape and colour.
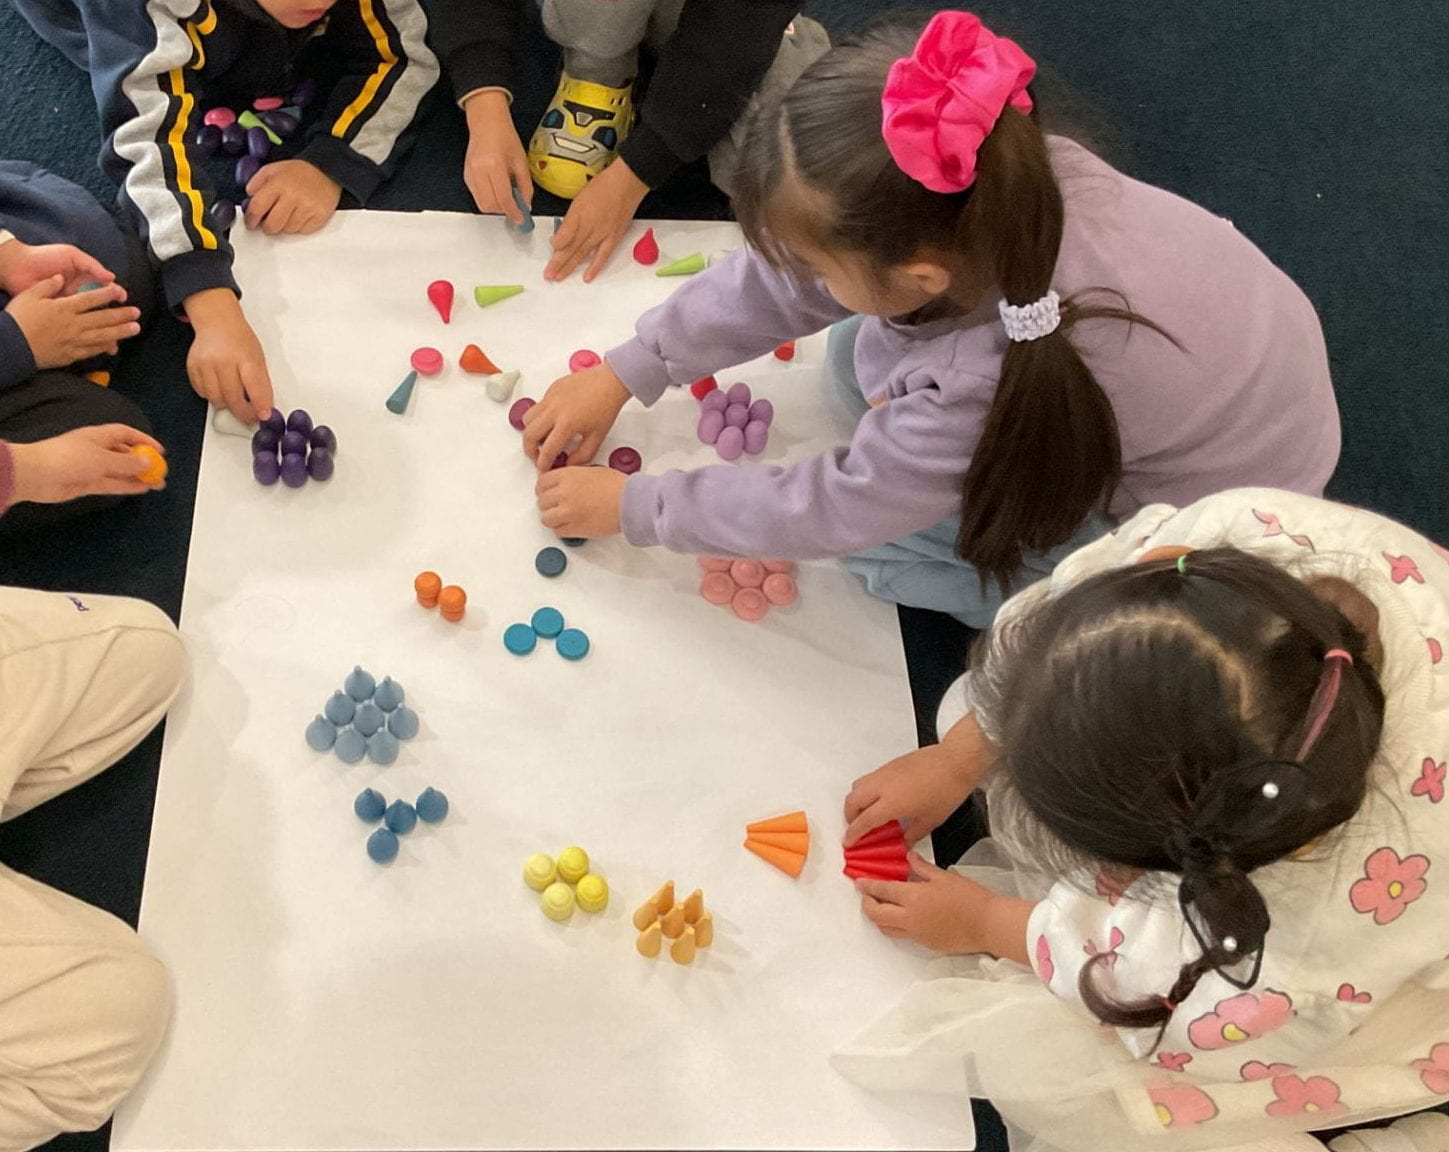 The team were reminded about the graph they had made previously, to help them think about how they might organise the information they had gathered. They moved the objects to a new piece of paper, placing the objects in lines.
 The team were given feedback on the placement of the objects, encouraging them to consider where the objects were placed in relation to the numbers they had written on the left side of the paper.
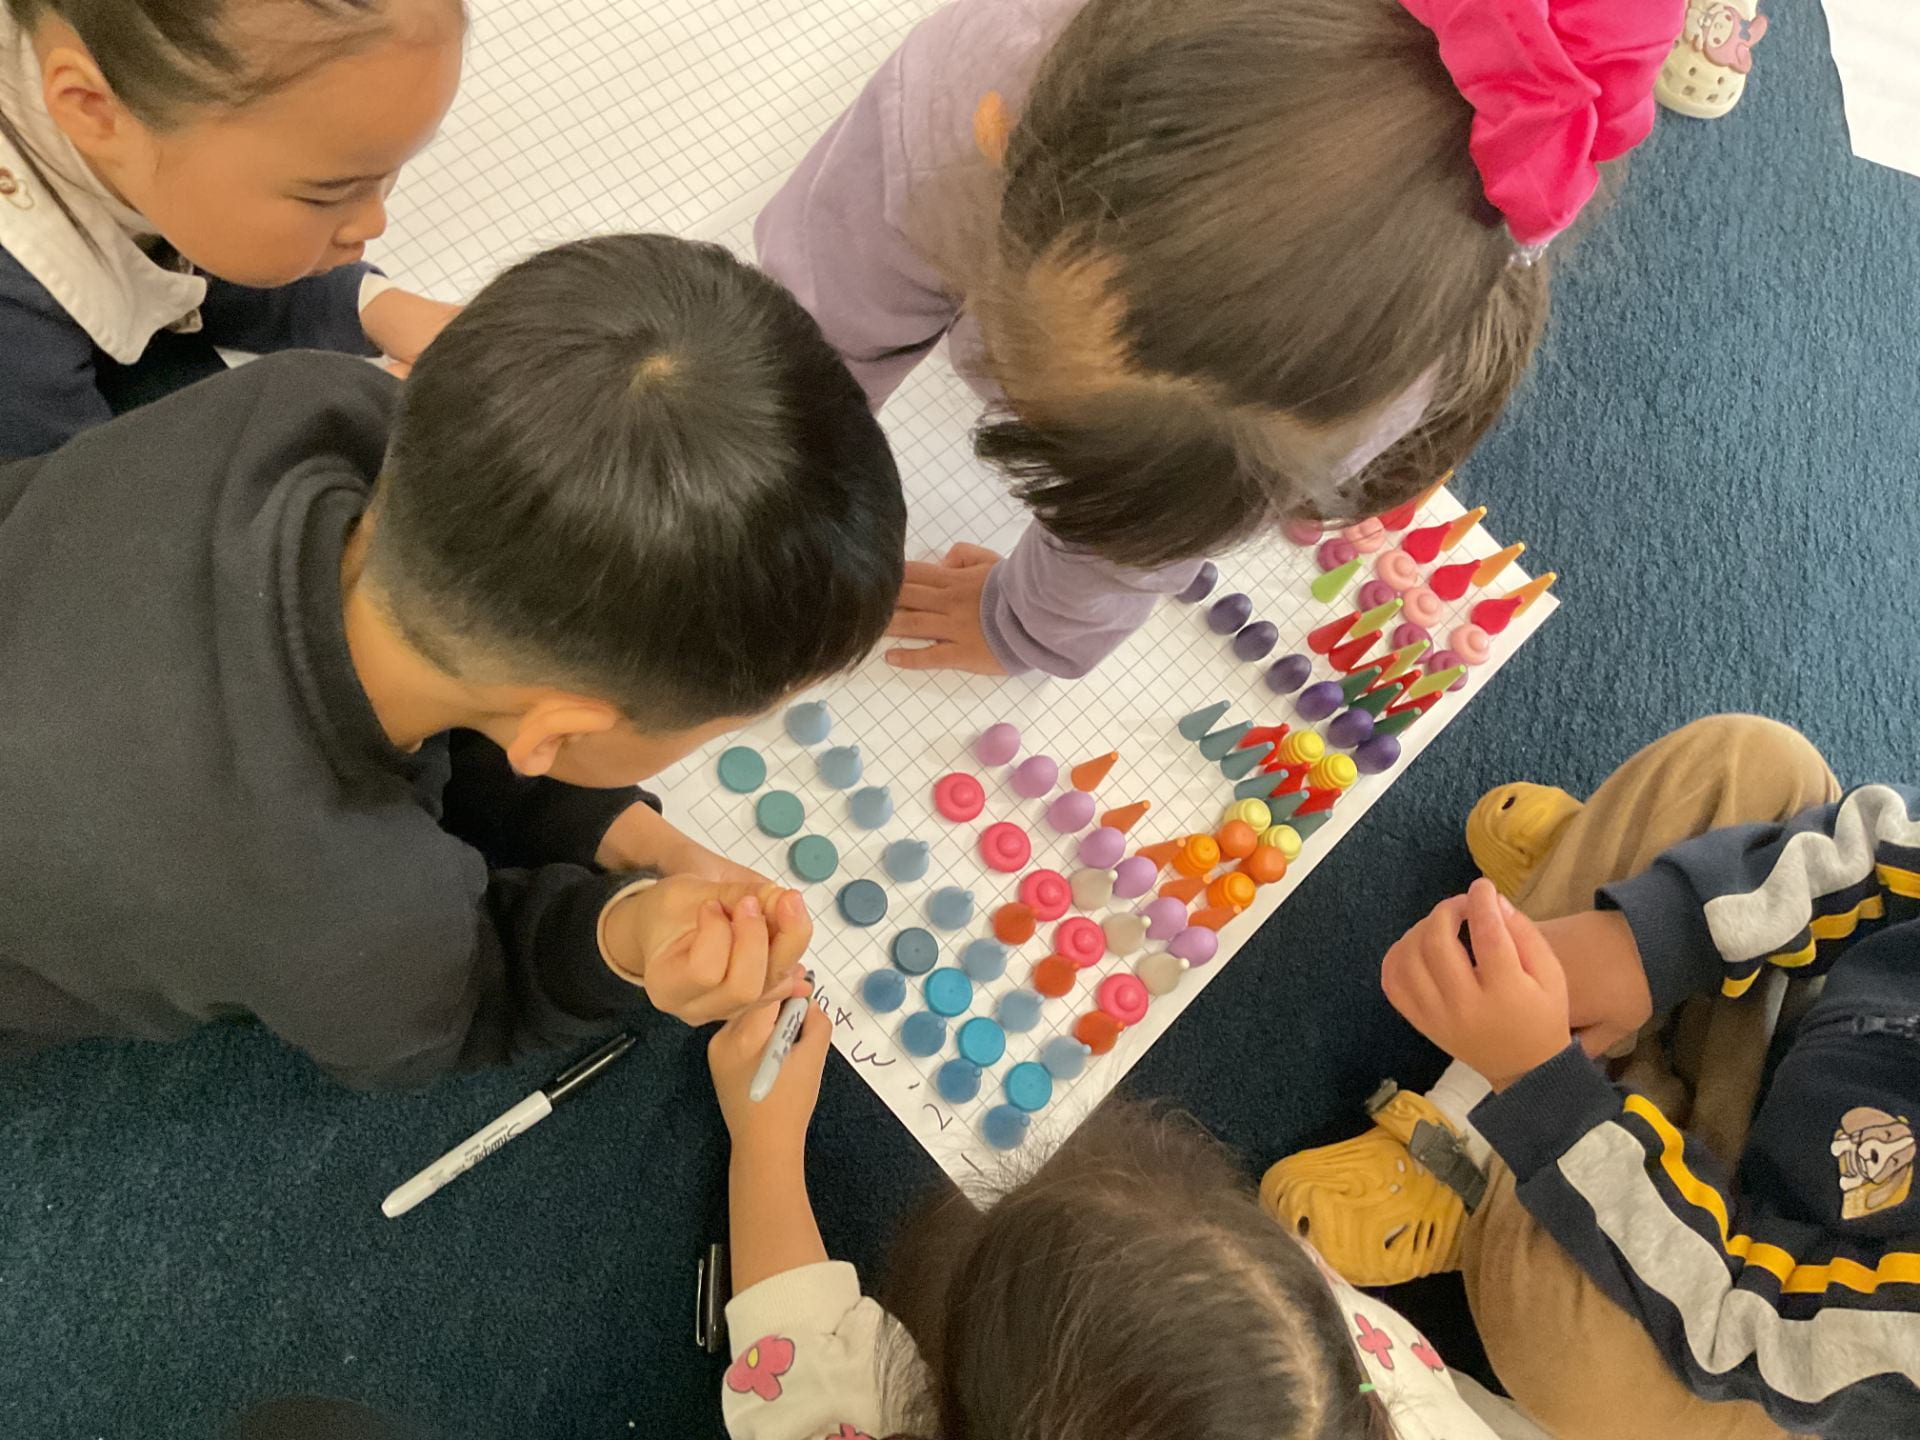
Finally, the teams included labels at the bottom of the chart paper to help others know the different categories. Together they decided that the title for the chart would be ‘Shape Tower Chart’.

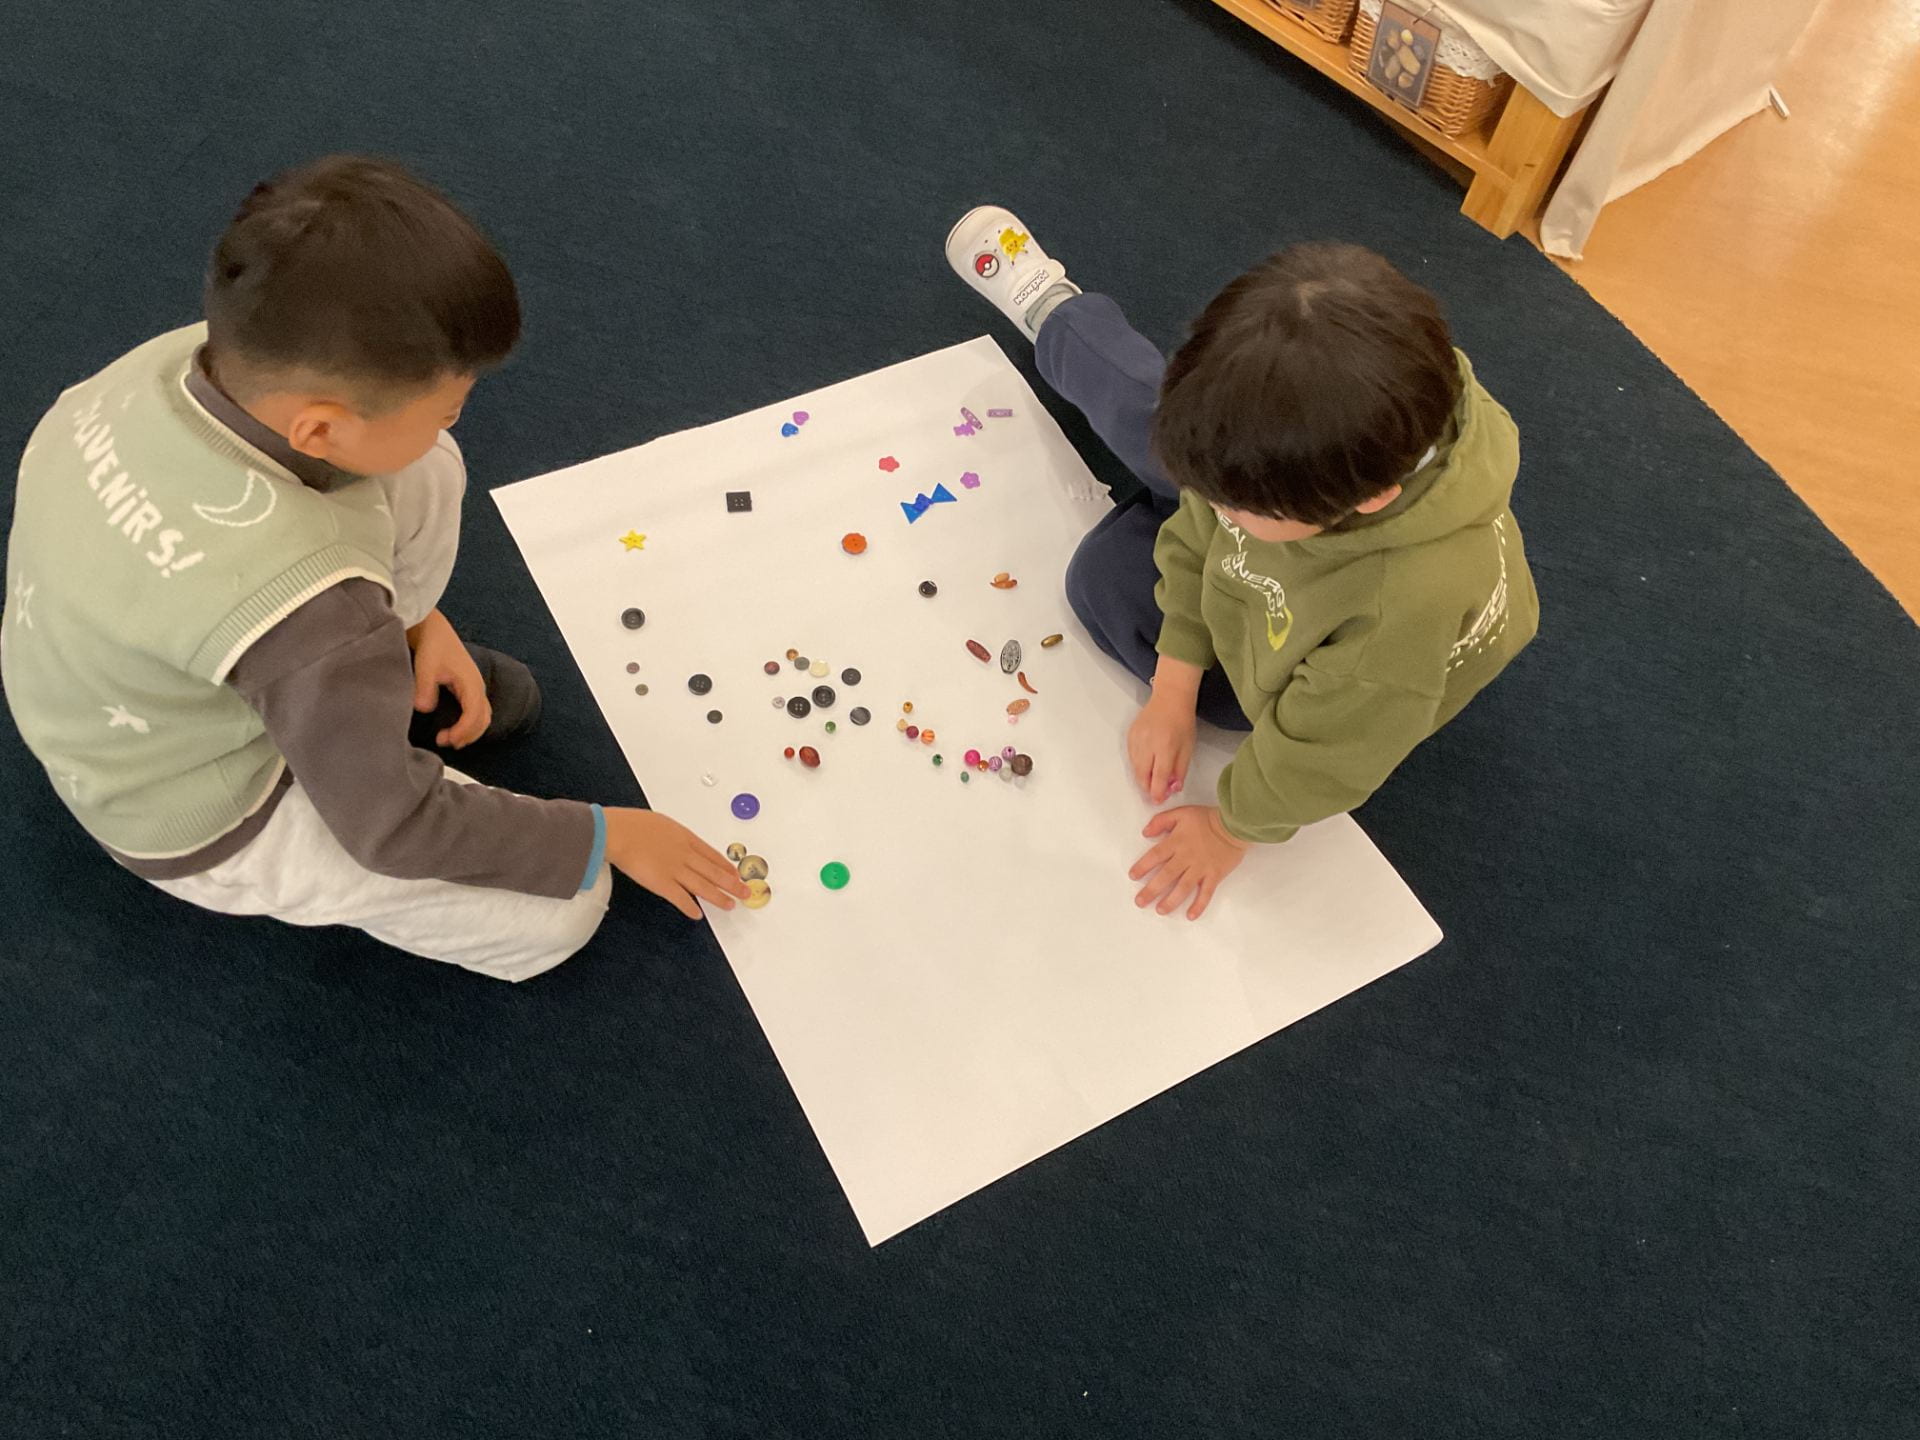
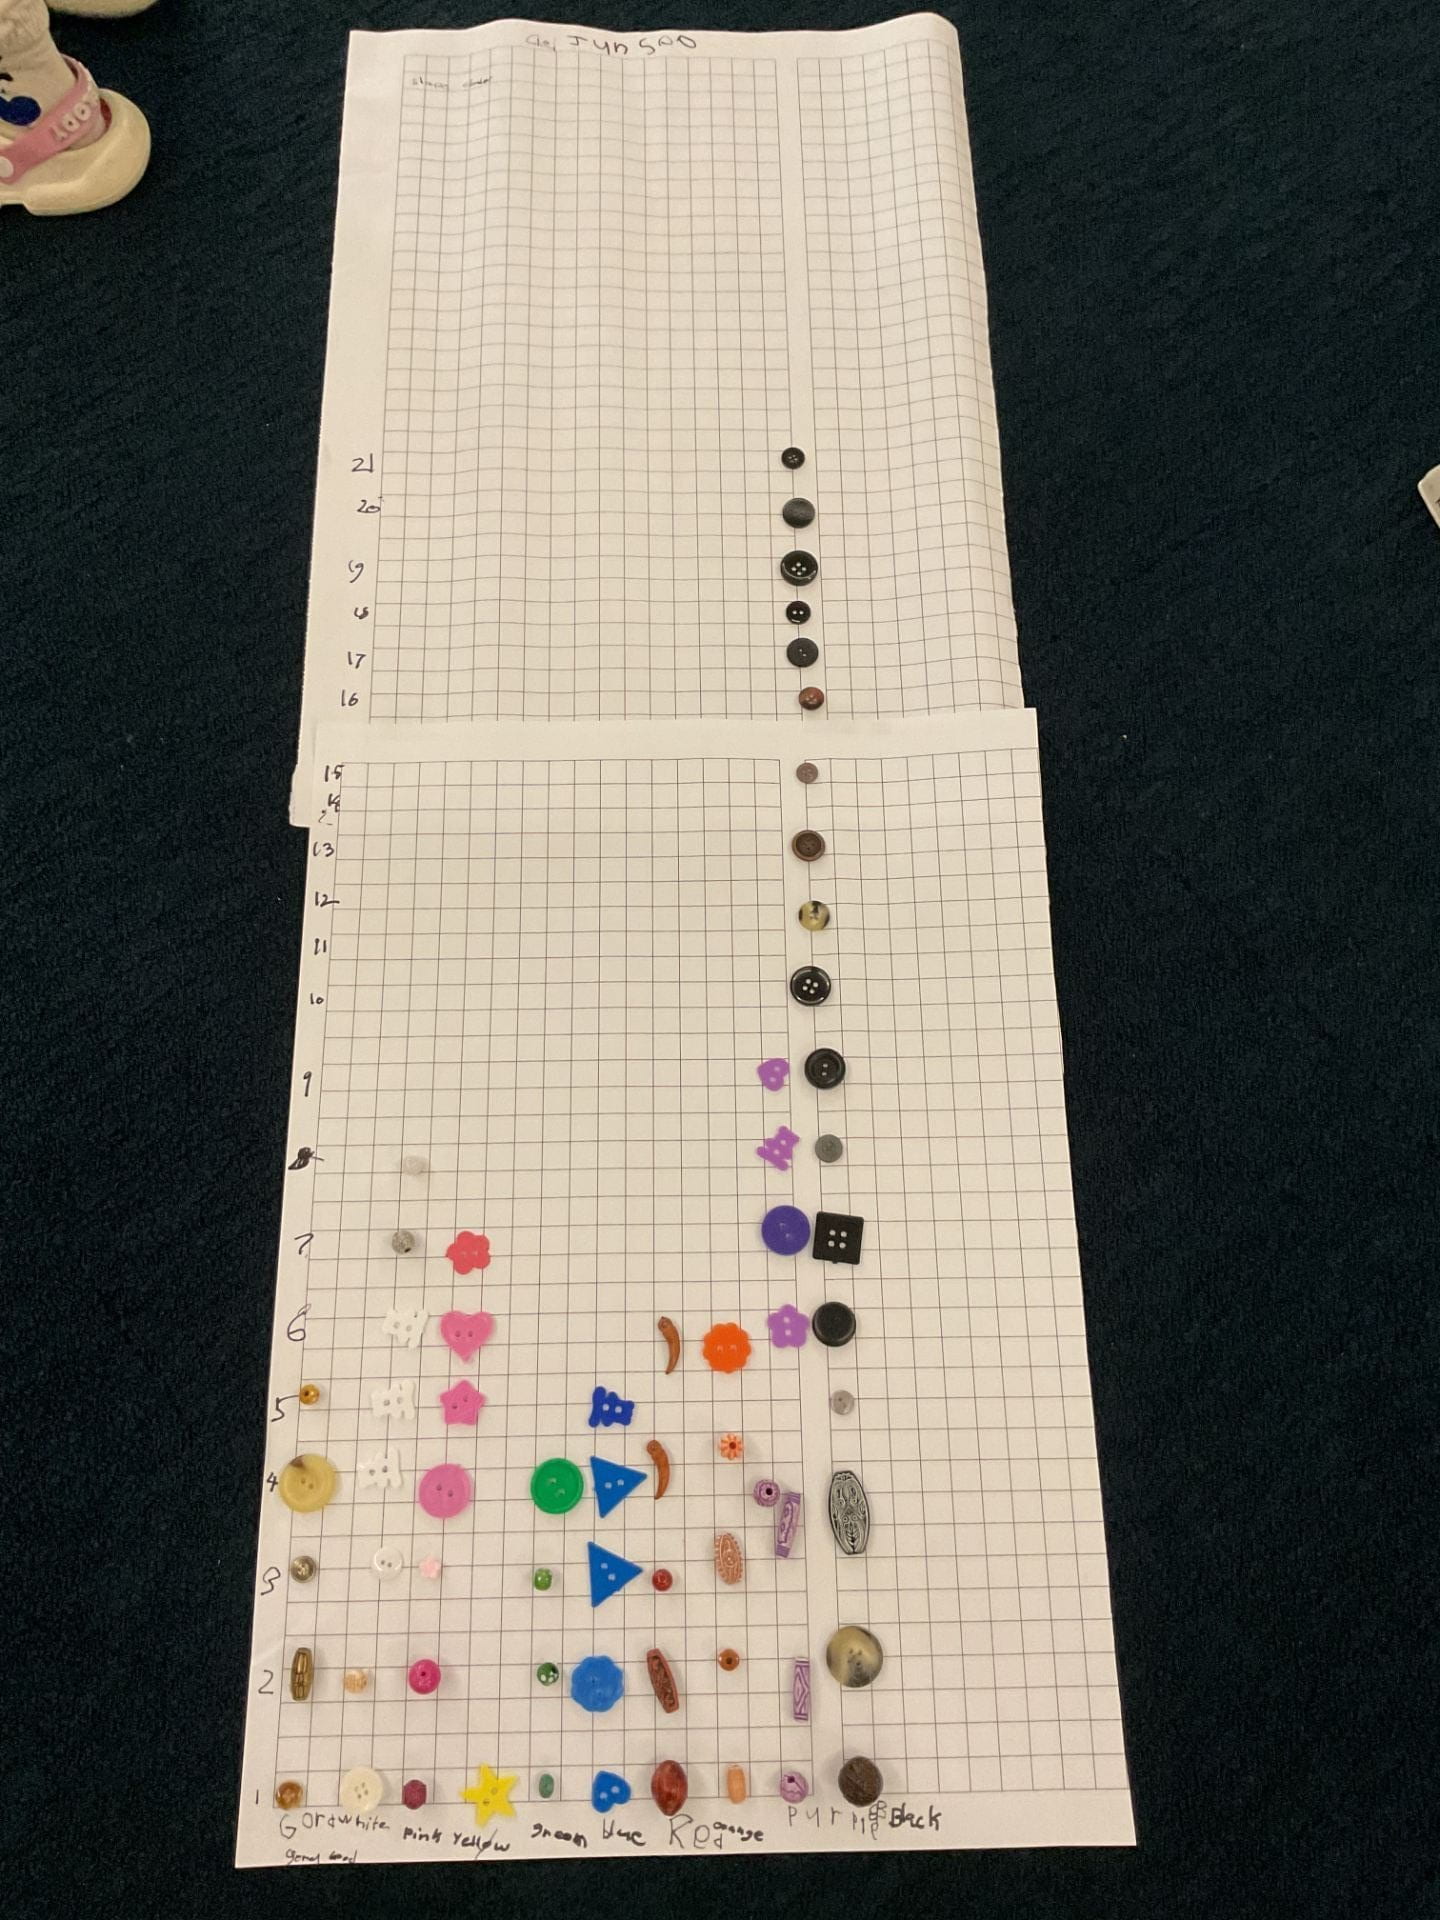
 A second team were given a bucket of loose parts. The team spent a lot of time discussing all the different objects in the bucket, talking about the shapes and colours, and deciding how they might want to sort the objects.
At first, they decided to sort them into two categories beads and buttons. After some negotiations, they decided to categorise them by colour instead.
 Having sorted all the different colours out, they transferred this information onto a new piece of chart paper. They were encouraged to refer to the ‘favourite Foods’ graph they had made previously, to help them notice other information that should be included on a graph.
They began to include labels and numbers on the graph and helped each other out with the spelling of the labels.
 They finally repositioned all the different objects to create an organised representation of data and labelled their graph ‘Colour Shape Graph’.
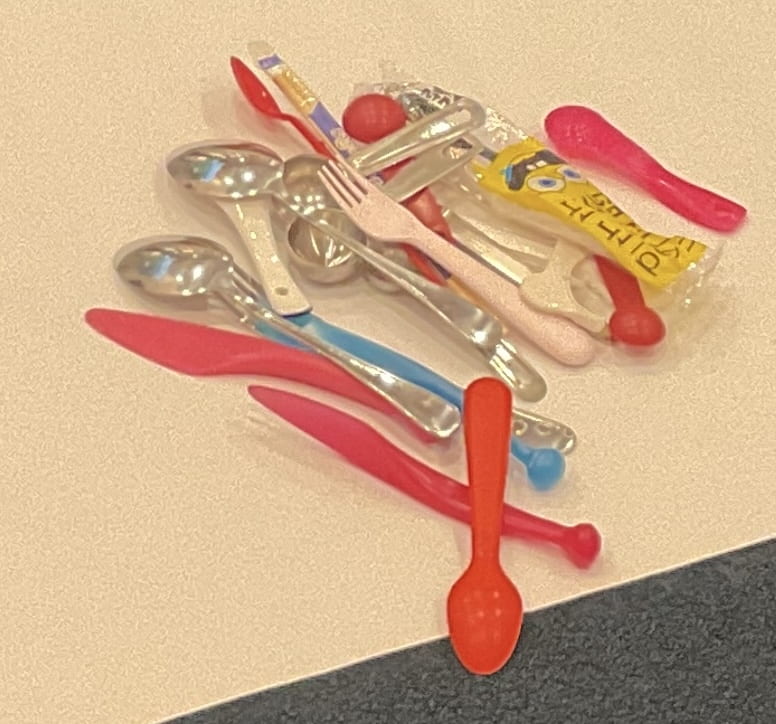 A third team was given a mixture of cutlery. The team shared and explained their ideas to each other and then came up with three ways of categorising the collection of cutlery: by colour, size and function.
 It took a long time for them to decide on the rule for the sort. They voted to sort by colour but decided to try out all three ways to see which one works best.
Finally, they agreed on sorting the cutlery by their function as this was ‘the best’. They sorted them into 5 categories, spoons, forks, knives, chopsticks, special spoon (for getting things like ice-cream, salt, or sugar).  They were encouraged to refer to the ‘favourite Foods’ graph they had made previously, to help them notice other information that should be included on a graph. They realised that organising the objects vertically rather than horizontally helped create a better graph. They included labels and numbers on the graph and helped each other out with the spelling of the labels.

They used Google Translate to find the word ‘tableware’. They finally repositioned all the different objects to create an organised representation of data and labelled their graph ‘Tableware Graph’.
Learning Outcomes:
- collect data
- sort and label real objects into more than 2 sets by more than one common attribute
- record data on simple tables
- present information using pictographs where one picture equals 1
- explain data using simple comparative language